Support and resistance
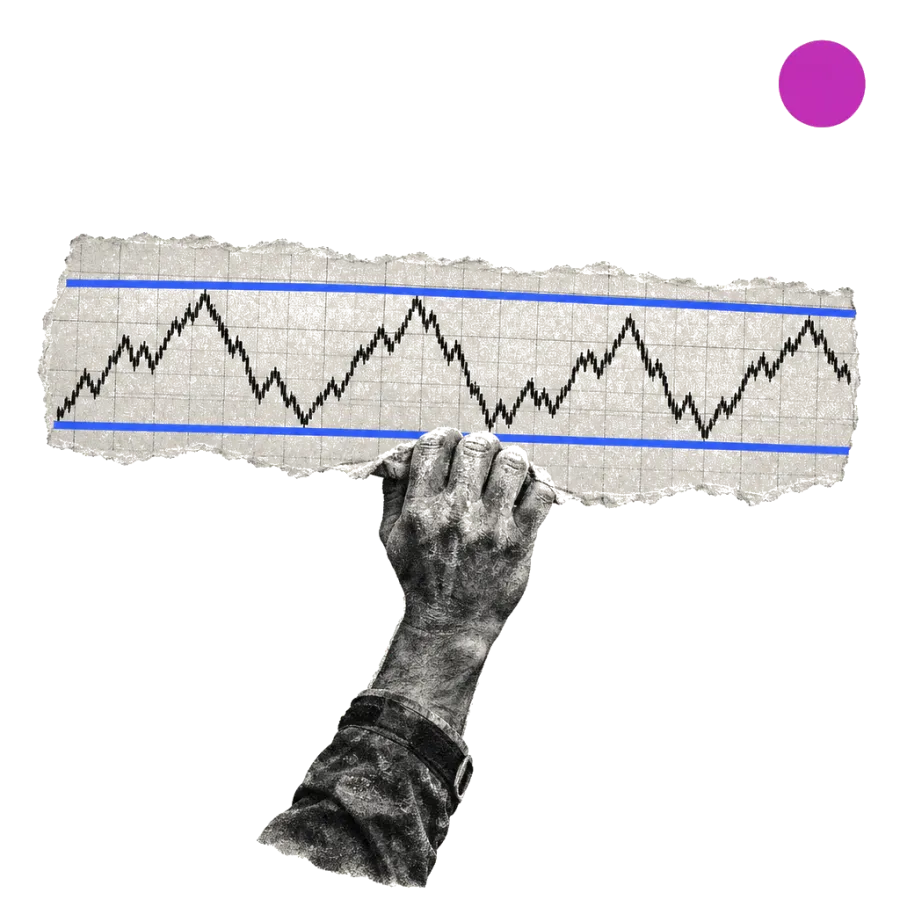
Look at almost any chart and you will see price stopping and turning at the same few prices again and again. Traders call the floor support and the ceiling resistance. They are not magic lines. They are places where many people made decisions before and may make them again.
Why levels form
- Memory. Buyers who missed a bounce at a price often wait for it to come back. Sellers who bought at a high want to get out at break-even when price returns there.
- Round numbers. Prices like 100, 50,000 or 2,000 attract orders simply because people set them.
- Previous highs and lows. The last swing high and swing low are watched by almost everyone looking at the same chart.
How to mark them
- Start on a higher timeframe, such as daily or weekly.
- Find at least two clear turning points at roughly the same price. Three is stronger.
- Draw a zone, not a thin line. Price rarely turns at the exact same cent.
- Keep only the levels closest to the current price. A chart covered in lines is harder to read, not easier.
When a level breaks
A level that breaks often swaps roles. Old resistance can become new support after price closes above it, and old support can become resistance after price closes below. Many traders wait for a close beyond the level, and sometimes for a retest from the other side, before treating a break as real. A wick that pokes through and closes back inside is a failed break, not a breakout.
Using levels to plan, not predict
Levels are most useful for planning risk. If you buy near support, the place where your idea is clearly wrong is just below that support. If you buy in the middle of a range, there is no obvious place to be wrong, so the risk is harder to size. The level does not tell you price will bounce. It tells you where the decision is.
| Situation | What it often means |
|---|---|
| Price bounces from support with a long lower wick | Buyers defended the level in this period |
| Price stalls under resistance on falling volume | Buyers are losing energy near the ceiling |
| Price closes above resistance on high volume | A breakout attempt with participation behind it |
| Price touches a level many times quickly | The level may be weakening with each test |
The free analyzer marks the support and resistance it can see on your screenshot and explains why they matter.
Find the levels on my chart